China Credit Expands Most Since March as New Lending Rebounds
Bloomberg News
Aggregate financing rose to 1.74 trillion yuan in November
Credit supply remains robust even amid property market curbs
China’s broadest measure of new lending jumped the most since March as the government pumped more credit into the financial system to support the economy, adding to concerns that the expansion may be too reliant on debt.
The Details
Aggregate financing rose to 1.74 trillion yuan ($252 billion) in November, compared with a median estimate of 1.1 trillion yuan in a Bloomberg survey and 896.3 billion yuan the prior month
New yuan loans climbed to 794.6 billion yuan from 651.3 billion yuan a month earlier, boosted by home loans
The broad M2 money supply increased 11.4 percent from a year earlier after climbing 11.6 percent the prior month
Economist Takeaways
“The policy tone from the PBOC will turn to more hawkish in the near future,” said Zhou Hao, an economist at Commerzbank AG in Singapore. “Authorities are concerned about the bubble risks in property, bond and commodity markets.”
“Private investment is recovering slightly,” said Tommy Xie, an economist at OCBC Bank in Singapore. “The rebound isn’t strong enough to offset the tapering property market, which will dampen the growth outlook for next year.”
Big Picture
The surge in new credit comes as the economy shows further evidence of strengthening. While policy makers are taking steps to rein in bubbles, credit-fueled acceleration is gathering pace as old smokestack industries regain momentum. President Xi Jinping is certain China will achieve its major economic goals this year, according to a statement released Friday.
The Details
Mid- and long-term household loans added 569.2 billion yuan last month, accounting for more than two thirds of total new yuan loans
Foreign currency deposits increased 11.4 percent from a year earlier, the People’s Bank of China said Wednesday. That was more than double the 4.8 percent rise in October.
— With assistance by Yinan Zhao, and Miao Han
Posted in Uncategorized | Comments Off on Credit Expands in China
I, like the FOMC, am doing everything in slow motion tbhis morning. This time next year, FOMC rate hike, take 3??
A year ago, markets expected the Fed Funds rate to be in a 0.75-1% range by now. By this evening, they are likely to have crawled to 0.50-0.75%. If for no other reason, that should caution anyone expecting much in the way of a hawkish message from the FOMC – this is a Fed leadership group whose main feature is it’s dovishness. Given that the single biggest source of economic uncertainty hanging over the US economy right now is the outlook for fiscal policy -what will President Trump do? – the temptation to be very, very bland in the statement that accompanies a thoroughly-discounted rate hike at 7pm GMT, is likely to be irresistible.
Where does that leave markets? Well, we’ve come full circle. The projected path of rates now is not that dissimilar from what it was a year ago. The big contrast is between what is discounted now, and what was discounted this summer, by when rate expectations had been ground into the mud by soggy growth, low inflation and volatile emerging markets. Which pretty much sums up the issue going forwards – as rates/yields move above levels seen when global markets ran out of steam at the start of this year, what is the danger of a repeat?
Dec 2015, real yields peaked as Fed hiked, $ soon after
With the Vix at 13, the Crossover CDS index back under 300, emerging market spreads falling and the S&P making a new high yesterday, it’s hard to imagine imminent collapse. The US economy is in better sort0-term shape and faces a fiscal boost. The European economy trundles on, Chinese data are surprising on the upside. Everything suggests that the fed can tighten further and yields rise further, before serious strains appear in markets. Which is a long-winded way of saying that the dollar can fly a little higher before it gets into trouble. We’re comfortable to stay long USD/JPY, and indeed long USD vs. most of Asian FX.
Overnight, Chinese credit data come in stronger than expected, with bank lending picking up and mortgage lending failing to slow down. Wei Yao also points out a big monthly increase in FX deposits onshore, a sign that capital outflows aren’t slowing. Looking forwards, we get Eurozone industrial production and more importantly for markets,. UK labour market data. We expect ex-bonus wage growth to pick up to 2.5%, and jobless claims to increase by 10,000. We remain short GBP/USD, expecting soft data eventually to help relative rate trends trump short-covering pressure. The US releases retail sales and industrial production data pre-FOMC.
China data suggest the economy is finding better traction
European economic data featured Italian IP, German CPI and ZEW, and UK prices
The news stream in North America will be subdued today, with only US import prices on tap
India reports November CPI; Chile central bank is expected to keep rates steady at 3.5%
The dollar is mostly firmer against the majors, albeit in very narrow ranges. Sterling and the Loonie are outperforming, while the yen and the euro are underperforming. EM currencies are mostly weaker. IDR, KRW, and THB are outperforming, while ZAR, TRY, and BRL are underperforming. MSCI Asia Pacific was up 0.3%, with the Nikkei rising 0.5%. MSCI EM is up 0.3%, even with Chinese markets falling 0.1%. Euro Stoxx 600 is up 0.8% near midday, while S&P futures are pointing to a flat open. The 10-year UST yield is down 1 bp at 2.46%. Commodity prices are mixed, with oil up 0.6%, copper down 0.7%, and gold down 0.4%.
The US dollar little changed against most of the major currencies. The dollar finished yesterday’s North American session on a soft note, but follow through selling has been limited. After rallying to near 10-month high above JPY116 yesterday, the greenback finished at session lows near JPY115.00. Initial potential seemed to extend toward JPY114.30, but dollar buyers reemerged near JPY114.75, and the pair rose back to the middle of the two-day range (~JPY115.40 area).
The Nikkei gapped higher yesterday, and despite the lower opening, the gap was not entered, and Japanese stocks recovered. The Nikkei closed 0.5% higher, extended its advance to the sixth consecutive session. The Topix gained a little more, and also extended its streak to six sessions.
China eclipsed Japan in terms of news. The data suggest the economy is finding better traction. November industrial output rose 6.2%. The median expected no change to the 6.1% pace seen in both September and October. It matches the 11-month average. Retail sales rose 10.8%, the most since last December. The Bloomberg consensus was for a 10.2% increase. Fixed asset investment was steady at 8.3%, as expected.
Chinese shares recovered from early losses. The Shanghai Composite fell 1.1% before recovering to eke out less than a 0.1% gain. Telecom, consumer staples, and energy led the way. Financials were the weakest sector, losing 1.2%. Some reports suggested that the PBOC, operating through a couple of major banks, may have intervened to sell US dollars around CNY6.9, but of course, confirmation remains elusive.
European economic data featured Italian industrial output, Germany CPI and ZEW, and UK prices. Like France and Germany, Italy’s October industrial production disappointed. The median forecast was for a 0.2% increase after a 0.8% decline in September. Instead, output was flat, with the year-over-year pace slipping to 1.3% from a revised 1.9% (from 1.8%).
Although Italian banks bad loan situation and the need to raise capital is the main focus outside of Italian politics, stronger and sustained growth could ease many of Italy’s problems. Among the banks, Monte Paschi has been the focus as its tries to raise five bln euros, including a debt for equity swap. Today it was Italy’s largest bank, Unicredit who announced plans for 13 bln euros in a rights offering next year as part of a larger restructuring effort. Note that the amount it wants to raise is almost as much as the present market value. In earlier capital raising exercises in 2008, 2009 and 2012, the bank raised 15.5 bln euros.
Italian bank shares opened lower after yesterday’s gains were reversed. However, the FTSE Italia All-Share Banks Index quickly recovered and is up nearly 2.8% near midday in Italy, putting the index near the three-day high. The broader Italian equity market is leading the major bourses higher with a 1.4% gain today. Over the five-day advance is 4.8%, matching the Nikkei’s advance over the same period. The Dow Jones Stoxx 600 is up 0.6% today and is up 3.3% over the past five sessions. Most sectors are higher, except for energy and materials.
Italy’s 10-year benchmark yield is off nine bp and is leading the decline in European bond yields today. Germany’s is off three basis points, while Spain is off two. Germany’s CPI matched the preliminary estimate, leaving the year-over-year rate at 0.7%. The ZEW survey showed a rise in the assessment of the current situation (63.5 from 58.8), while the expectation component was unchanged at 13.8%.
The euro was unable to extend yesterday’s recovery that carried it to about $1.0650. It has held above $1.06 so far but looks vulnerable to a push into the $1.0580 area. Sterling is the strongest of the majors, up about 0.2% and extended yesterday’s gains. Last week’s highs are a half a cent higher at $1.2775. However, we suspect that additional gains above the $1.2725 area will require a broader dollar pullback.
The UK reported CPI readings a little firmer than expected. The year-over-year headline rate rose to 1.2%, the highest in two years. The core rate rose to 1.4% from 1.2%. The decline in sterling is adding to the inflation pressures. UK import prices rose almost 15% in the year through November, the quickest pace in five years. ONS reported that clothing, motor fuels, and electronic equipment prices rose the most.
Output prices rose 2.3%, which is also a bit quicker than expected. It is the strongest rise since April 2012. Input prices fell 1.1% on the month, but the year-over-year pace quickened to 12.9% from a revised 12.4% (was 12.2%). The Bank of England meets this week. It is expected to tolerate upward pressure on prices, though its tolerance is not infinite. Base effects and sterling may obfuscate the underlying signal until H2 17.
The news stream in North America will be subdued today, with only import prices on tap. A soft report is expected. Things pick up tomorrow with the retail sales, PPI, and industrial production data, and, of course, the FOMC meeting.
India reports November CPI, which is expected to rise 3.9% y/y vs. 4.2% in October. It reports November WPI Wednesday, which is expected to rise 3.1% y/y vs. 3.4% in October. The RBI delivered a hawkish surprise last week and kept rates steady. Most were looking for another 25 bp cut. Next RBI meeting is February 8. A lot can happen between now and then, but if inflation continues continue to fall, then a cut then seems likely.
Chile central bank is expected to keep rates steady at 3.5%. CPI inflation ticked higher to 2.9% y/y in November. While this is still below the 3% target, we do not see easing until Q2 2017, if at all. The economy remains very weak, but policymakers will have to be cautious in cutting rates if the Fed is raising rates.
The WSJ details a purchase of 16,000 S and P minis last Wednesday (it wasnt me as I deal in one lots) which they speculate was a hedge of a derivative trade.
Via the WSJ:
By
Alexander Osipovich
A $1.8 billion futures trade that fueled buying in the U.S. stock market on Wednesday was the biggest transaction of its kind all year, according to new analysis, and comparable in size to the “fat finger” trade said to have set off the May 2010 “flash crash.”
The analysis by MayStreet LLC, a market-data firm, shows that an unknown buyer on Dec. 7 purchased around 16,000 E-mini S&P 500 futures contracts at 1:21 p.m. New York time.
“It was a massive trade and it happened quickly,” said Mehmet Kinak, head of electronic trading at T. Rowe Price Group Inc.
The trade occurred after muted morning gains by the stock market, which then soared in the afternoon after the transaction, with the S&P 500 closing at a fresh record of 2,241.35 on Wednesday and then extending gains into Thursday and Friday.
The trade was parceled into scores of individual transactions, but raw data show that all of them took place at the same nanosecond and fell within boundaries indicating where one trade ends and the next trade begins, according to the analysis. That is a strong indication they were all part of one big trade, MayStreet said.
Taken together, the purchase was more than double the size of the second-biggest E-mini trade in 2016, in which someone sold about 7,000 contracts, or around $645 million, on Jan. 15, MayStreet said.
E-mini contracts are used by traders to bet on or hedge against future moves in the S&P 500 stock-market index, and large moves in the price of E-minis can have knock-on effects in the stock market.
Wednesday’s order sparked a frenzy of superfast trading as other market participants piled in and a total of $3.4 billion worth of E-minis changed hands within two seconds, including the original transaction, MayStreet said. The firm’s analysis is based on nanosecond-level trading data from CME Group Inc., which runs the exchange where the contract is listed.
It is unclear who stood behind the trade. CME Group said it couldn’t comment on “the specifics of any particular order.” Traders and analysts say the most likely explanation is that an algorithm triggered the large purchase when the E-minis hit a key threshold. Trading records show the buying began just as E-minis reached 2,225 points, a round number, as well as an intraday high.
That suggests a computer program unleashed the buying, perhaps on behalf of a bank that needed to automatically hedge a trade in stock-market derivatives, according to Joshua Lukeman, a managing director in the equities-trading division of Credit Suisse Group AG.
“It felt like the beginning part was electronic because it went through the pipe so quickly,” Mr. Lukeman said. Then there was a “snowball effect of other folks rushing in,” he added.
Heavy bursts of volume in E-minis aren’t unusual, but they tend to take place when the stock market closes, at 4 p.m. ET, not in the middle of the day. The one-minute interval including Wednesday’s early afternoon trading frenzy was the fifth-busiest minute of the year in E-minis, while all of the other top 10 highest-volume minutes took place right around 4 p.m., according to MayStreet.
That makes Wednesday’s event an “anomaly,” said Michael Lehr, the firm’s co-founder. “A large intraday movement is unexpected.”
It wouldn’t actually cost a company $1.8 billion to put on a futures trade the size of Wednesday’s transaction. A firm seeking to buy futures must make an upfront payment, called initial margin, and then it either earns money if the price of the contract rises or it needs to make additional payments if the price falls. Initial margin for a $1.8 billion E-mini trade is about $83 million, according to a CME Group spokeswoman.
Big trades in the E-mini contracts have drawn attention before, most notably a botched trade that is said to have contributed to the flash crash of May 6, 2010, in which the Dow Jones Industrial Average dropped nearly 1,000 points within minutes before regaining much of its value just as quickly.
A September 2010 report by federal regulators said a key factor in the flash crash was a massive E-mini trade, in which a mutual-fund firm sold 75,000 of the contracts. The firm accidentally instructed its trading program to dump them all in a series of sell orders over 20 minutes, rather than spreading the sell orders out over a much longer time period, according to the joint report by the Securities and Exchange Commission and the Commodity Futures Trading Commission.
The regulators didn’t name the firm, but media reports have identified it as Waddell & Reed Financial Inc. in Overland Park, Kan. Waddell hasn’t confirmed whether it was the firm in the report, though it released a statement shortly after the flash crash saying it had been trading E-minis that day.
The total size of the huge E-mini sale was about $4.1 billion, and in the 13 minutes between when the mutual-fund firm started selling the contracts to the nadir of the flash crash, the firm’s program sold approximately $1.9 billion worth of E-minis, according to the joint SEC-CFTC report.
OPEC Deal Will Create Oil-Supply Deficit in First Half, IEA Says
by
Grant Smith
Stockpiles to shrink by 600,000 barrels a day as producers cut
Russia to gradually implement the reduction pledged on Dec. 10
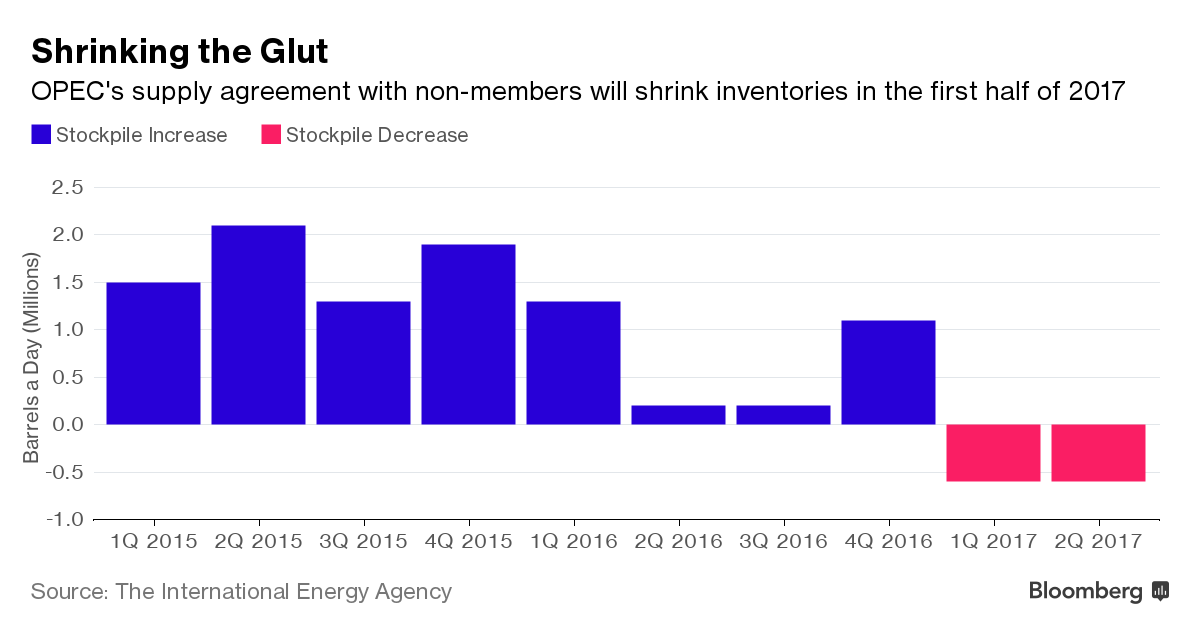
Global oil markets will swing from surplus to deficit in the first half of 2017 as OPEC and other producers follow through on an agreement to cut supply, according to the International Energy Agency.
Oil stockpiles will decline by about 600,000 barrels a day in the next six months as curbs by OPEC and its partners take effect, said the agency, which had previously assumed inventories wouldn’t drop until the end of 2017. Russia, the biggest producer outside OPEC to join the deal, will gradually implement the full reduction it promised, according to the IEA.
Oil has gained more than 16 percent since the Organization of Petroleum Exporting Countries agreed on Nov. 30 to trim output for the first time in eight years, an accord expanded on Dec. 10 with the participation of 11 non-members including Russia and Kazakhstan.
“Before the agreement among producers, our demand and supply numbers suggested that the market would re-balance by the end of 2017,” the Paris-based agency said in its monthly market report. “If OPEC promptly and fully sticks to its production target” and other producers cut as agreed, “the market is likely to move into deficit in the first half of 2017.”
The stockpile declines will only occur if OPEC reduces supply enough to meet and maintain a target of about 32.7 million barrels a day, the agency said. The organization pumped a record 34.2 million a day in November, according to the IEA, which advises 29 nations on energy policy.
There are some signs the market is already starting to tighten. While inventories of crude and refined oil in industrialized nations remain 300 million barrels above their five-year average, they dropped for a third month in October, the longest run of declines since 2011, according to the agency.
As a result of the Dec. 10 deal, the IEA chopped its 2017 estimate for total non-OPEC supply growth in half, to 220,000 barrels a day. Non-OPEC supply will average 57 million barrels a day next year.
The IEA reduced its 2017 forecast for production in Russia, which promised to deliver half of the total non-OPEC cut, by 140,000 barrels a day. Russian output of crude and condensate will fall to 11.3 million barrels a day in the second quarter from 11.6 million in the fourth as the country gradually implements a cut of 300,000 barrels, according to the report.
While Kazakhstan also agreed to make a minor reduction, the IEA kept its projections for the country unchanged following the government’s insistence that output from its three largest fields won’t be constrained. Kazakh production will grow by 160,000 barrels a day next year.
The agency increased its forecast for global oil demand in 2017 by 100,000 barrels a day. Consumption will rise by 1.3 million barrels a day, or 1.4 percent, to 97.6 million a day.
Posted in Uncategorized | Comments Off on From Surplus to Deficit
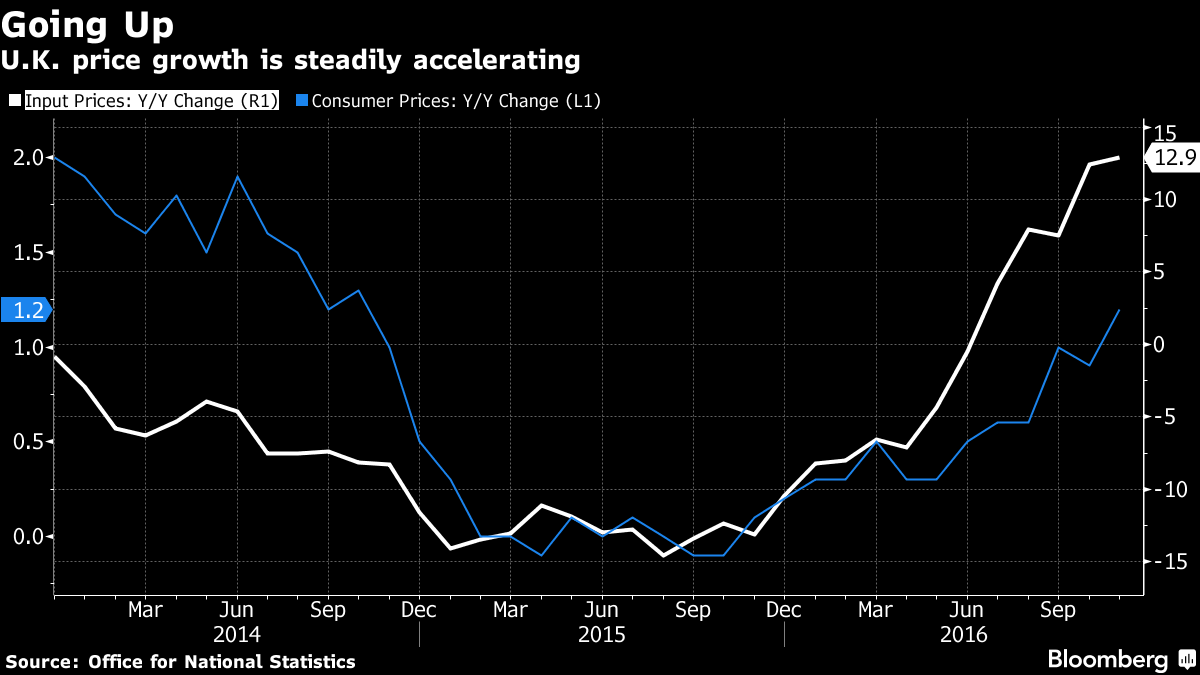
U.K. inflation accelerated more than economists forecast in November, boosted by prices for clothing and gasoline.
The jump to 1.2 percent from 0.9 percent in October means consumer prices are rising at the fastest pace since October 2014. Economists had anticipated an increase to 1.1 percent.
The latest data from the Office for National Statistics also added to evidence of the buildup in inflation pressures because of the pound’s decline since Britain voted to leave the European Union and rising oil costs. U.K. import prices surged almost 15 percent in November, the biggest annual increase in five years, and upward pressure from energy may intensify after this month’s output cut by OPEC.
The rapid change in the outlook for prices in recent months has forced the Bank of England to shift its stance after cutting interest rates in August following the Brexit vote. Economists forecast the BOE will keep the key rate at a record-low 0.25 percent when it announces its final decision of 2016 on Thursday.
“We expect consumer price inflation to trend markedly higher over the coming months as sterling weakness increasingly feeds through,” said Howard Archer, an economist at IHS Markit in London. Still, “the BOE will be pretty tolerant on the probable appreciable inflation overshoot given the prolonged, highly uncertain outlook that the U.K. economy is likely to face as the government negotiates the exit from the EU.”
The pound rose against the dollar after the data were released and was at $1.2707 as of 10:05 a.m. London time, up 0.2 percent on the day.
Clothing, Fuel
The ONS said the largest upward effect on the annual inflation rate in November came from clothing, motor fuels and equipment such as computers and laptops. On the month, prices increased 0.2 percent.
Separate data showed factory-gate prices rose an annual 2.3 percent in November, the most since April 2012. Input prices surged 12.9 percent year-on-year, with import costs up 14.6 percent.
With forecasts pointing to a sharp inflation pickup in 2017, BOE officials dropped guidance last month indicating that lower rates were likely before the end of the year, instead saying they could respond “in either direction” to the economic outlook.
Almost two-thirds of analysts surveyed by Bloomberg see the BOE’s next move — when it comes — as a rate hike as policy makers confront inflation that could exceed their 2 percent target by early next year.
Core inflation — which excludes volatile food and energy prices — increased to 1.4 percent in November from 1.2 percent in October, the ONS said. That was faster than the 1.3 percent predicted by economists in a Bloomberg survey.
Posted in Uncategorized | Comments Off on Whiff of Inflation in UK
Solid Chinese data overnight have done nothing to quell concerns about the unsustainable nature of the Chinese rebound, but they have underpinned risk sentiment in afternoon Asian trading. USD/JPY isn’t back up to yesterday morning’s euphoric high above 116, but at least it’s back to yesterday’s opening levels and the uptrend survives. Maybe the overall mood can be summed up there, as underlying positive risk sentiment is kept in check by pre-FOMC nerves. Simon Wren-Lewis wrote an entertaining blog post here <http://www.sgmarkets.com/r/?id=h11f331e2,194fcac7,194fcaca> pointing out (broadly speaking) that all City scribblers are good for is telling stories. Sadly, the only convincing story today is that on the day before the final major policy move of 2016, less than two weeks before Christmas and with a hunk of Southern England cut off by a rail strike, markets are garbled.
The Euro has however bounced back, again, after last week’s wobble. If I tell stories about EUR/USD they are mostly framed by what is happening to real yields and peripheral spreads, neither of which gives the Euro bear much encouragement this morning. The Bund/BTP spread narrowing is particularly striking given nervousness about the banking system. We get ZEW data in Germany this morning and we get USD 12bn in 30year Bonds in the US this evening. Unless the latter revives the uptrend in US yields, we will go into the FOMC waiting for a hike that’s virtually 100% priced-in and we’re probably dependent on renewed concern about European politics to unlock any fresh move lower by the Euro.
Despite the fact that oil prices are keeping the Rouble twinkling at the top of the overall FX Christmas tree the best G10 currency this week is Sterling. Relative rates suggest this is a good place to go short vs. the dollar and relative real yields suggest this is a good place to go short against the Euro, but positioning is still problematic and this morning’s CPI are a challenge. We’re looking for core CPI to edge up to 1.4% from 1.2%, a tick more of a rise than consensus. We’re short GBP/USD and squirming slightly at the moment….
Other trades we like here are to be short EUR against both NOK and SEK. UJSD/CAD has broken below key support and we won’t touch it long or short) until oil settle into a new range. AUD and NZD are expensive and supported by the Chinese data, so I’m not sure there is anything to do there either.
§ There has been increasing chatter about Treasury issuing bonds with a maturity greater than 30yr. It would help fund higher deficits, help extend the average maturity of the debt and take advantage of the current low levels of term premium. It could also allow Treasury to tap into another investor base—domestic ALM investors or Japanese lifers.
§ However, insurers and pensions currently don’t seem to own too many Treasuries. It is not clear how much the demand for the ultra long end will cannibalize current demand for the 30yr. Ultra long issuance is also likely to be a buy-and-hold product with lower liquidity. Meanwhile, negative swap spreads highlight that Treasuries are cheap to swaps (we believe due to higher cost of dealer balance sheet). This issue will be starker in the very long end due to the longer duration and likely demand for the P-STRIPS (resulting in orphaned C-STRIPS). One potential way for the Treasury to overcome this challenge would be to issue standalone P-STRIPS as opposed to whole bonds, but that might result in potential logistical challenges for some dealers.
§ While the yield of a 50yr should be lower than a 30yr due to convexity benefits, it may initially suffer from an illiquidity discount. Comparing to the last two new products that Treasury introduced, we expect the market’s reception to a 50yr to be less favorable than to FRNs (since that investor base already existed in agencies and money fund form reform brought in more demand) but not as difficult as TIPS (which had no obvious captive investor base). The ultra futures contract did see volumes pickup following its introduction, suggesting that it may simply take additional time for 50yr bonds to become liquid.
§ We do not expect Treasury to make the decision on issuing ultra long-dated Treasuries in a hurry or without due consideration. Treasury will evaluate the decision relative to its objective of bringing regular and predictable issuance to market at the lowest cost to taxpayers over time. We expect higher issuance needs in 2017 to initially be met with bills and then across the coupon curve. We do not expect Treasury to bring an ultra long-dated issue to market until 2018 at the earliest.
The Volatility Paradox: Calm Markets but Soaring ‘Fear Gauge’ Trading
Investors look to make quick profits during isolated periods of market tumult
By
Gunjan Banerji
Trading in volatility-linked investments set records in 2016 during a mostly calm year in markets, underscoring the popularity of exchange-traded products that didn’t exist a decade ago.
Daily volume in the five most-traded exchange-traded products that track the CBOE Volatility Index, or VIX, hit a record 84.9 million shares on average this year, FactSet data compiled by The Wall Street Journal show. That is almost double the high set in 2015. The products—exchange-traded funds and notes—trade in real time like stocks on an exchange.
Protecting against losses was once the dominant reason to use volatility products, but investors now are turning to them to make quick profits during isolated periods of market tumult, usually holding them for no longer than one or two days. The VIX measures investor anxiety by looking at the prices they are willing to pay for options tied to the S&P 500 index.
But while individual investors and hedge funds have flocked to these exchange-traded products, or ETPs, the products’ record tracking Wall Street’s “fear gauge” has been poor, making investors vulnerable to big losses if held too long.
The VIX’s average this year is 16, in line with its five-year mean. But in 2016, long periods of calm were punctured by volatility spikes after events like the U.K. vote to leave the European Union in June and in the days leading up to the U.S. presidential election, creating trading opportunities for some.
“I’m not using them as a portfolio hedge. I usually look to use them when there’s a lot of momentum,” said Mark Sebastian, chief investment officer of volatility hedge fund Karman Line Capital, which manages $1.75 million. Mr. Sebastian trades the ETPs through his personal account.
VIX-linked ETPs have become a valuable niche business for providers like Barclay PLC’s iPath and Janus Capital Group Inc.’s VelocityShares and ProShares. The five most-traded VIX-linked ETPs, according to research firm Tabb Group, collectively hold $3 billion in assets.
The iPath S&P 500 VIX Short-Term Futures exchange-traded note, or ETN, is the largest with $1.3 billion. The note has plunged 68% this year and has slumped every year since its inception, FactSet data show. The VelocityShares Daily 2x VIX Short-Term ETN, which has about $230 million in assets, has tumbled 94% this year after sliding 77% in 2015. In comparison, the VIX has declined 35% this year.
“VIX futures ETFs are valuable tools and have been used successfully by many investors to help manage risk or pursue returns,” a ProShares spokesman said. “Our experience is that these ETFs are generally used tactically by knowledgeable investors who understand the benefits and risks.” Barclays’s iPath declined to comment, while VelocityShares didn’t respond to a request for comment.
Part of the appeal for individual investors is that they trade like stocks, said Michael Palmer, a VIX options specialist at trading firm Group One Trading. Futures and options based on the VIX have also exploded in popularity, but investors don’t have to be registered to trade the ETPs.
The Sunday before the election, Federal Bureau of Investigation Director James Comey said a review of new evidence gave the bureau no reason to reverse its earlier recommendation that Hillary Clinton not face charges related to her email practices while secretary of state. When markets reopened on Monday, Mr. Sebastian started buying bearish options on the ProShares Ultra VIX Short-Term Futures ETF, betting the VIX would fall. The product uses double leverage, meaning an investor can double the return.
The VIX dropped 17% that day, setting up Mr. Sebastian to profit. “I want to make at least twice what I paid,” he said.
Mr. Sebastian’s trade shows how such exchange-traded products have allowed investors who can make well-timed bets to reap quick profits. Conversely, they can post big losses if held for too long.
Volatility ETPs have been prone to decline faster than the VIX during quiet spells in the market, because issuers of the securities constantly need to buy pricier longer-dated VIX futures and sell cheaper shorter-dated contracts.
Investing in these ETPs can be “like holding a stick of dynamite,” said Christopher Cole, the Austin, Texas-based founder of money manager Artemis Capital Management LP. “Owning [the VelocityShares Daily 2x] into the right volatility spike can be very profitable. But if you hold on to the stick of dynamite for too long, your hand will be blown off.”
The VIX’s plunge this year puts it on track for its biggest decline since 2009. Still, volume in these securities reached an unprecedented 3.55% of all trading on U.S. exchanges on Sept. 13, compared with an average of 0.2% in 2012.
Macroeconomic events like the U.S. election and the U.K. referendum “lend themselves to trading in volatility products,” said Group One’s Mr. Palmer.
Trading volatility offers a form of diversification that has become difficult to find in a world of correlated stock prices and ultralow interest rates. Volume in the products has been a rare bright spot in an otherwise dim year amid flat options volumes.
“The word is just getting out that volatility as an asset class is not really correlated to equity returns or fixed-income returns,” said Todd Hawthorne, lead portfolio manager of Redwood Strategy, the volatility strategies fund of Boston Partners, which manages $81.5 billion in assets.
The Federal Reserve’s meeting this week and questions surrounding Donald Trump’s policies will support the continued use of VIX-linked ETPs, said Josh Thimons, a managing director at Pacific Investment Management Co.’s multiasset volatility fund.
Demand “will ebb and flow as uncertainty and fear ebb and flow,” said Mr. Thimons.
China’s Stocks, Bonds, Yuan Slump in Unison on Liquidity Concern
Bloomberg News
Shanghai Composite Index retreats most in six months
One-year sovereign debt yield increases 15 basis points
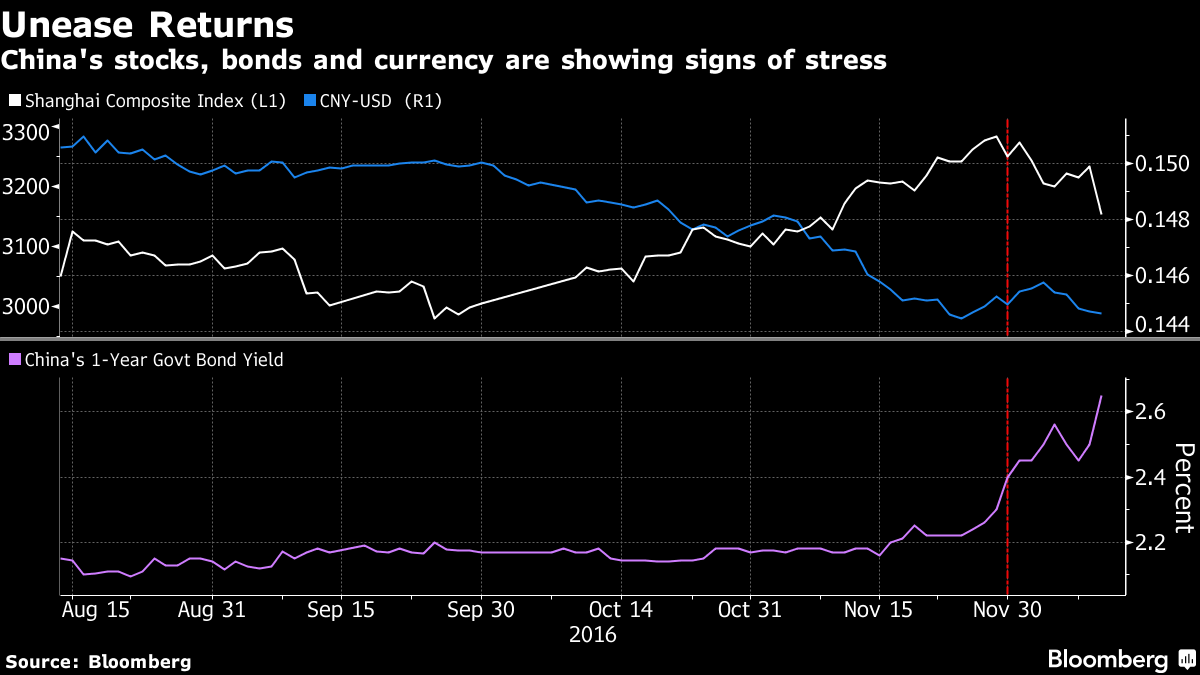
Unease is once again permeating China’s financial markets.
The Shanghai Composite Index sank 2.5 percent at the close, the yuan fell toward an eight-year low, while government bonds tumbled, with the one-year sovereign yield rising 15 basis points. Analysts had a long list of reasons for the synchronized selloff, from President-elect Donald Trump’s questioning of the decades-old One China policy, to a regulatory crackdown to insurers’ stock investments, higher money market rates and concern that property prices are poised to fall.
The losses are a reminder of the turmoil that dogged China’s financial markets at the start of the year, which gave way to relative calm throughout much of 2016 even as the yuan tracked lower. A resumption in headline-grabbing losses would pose a challenge to the government’s attempts to cut corporate leverage, whether in equities or property, while also risking fueling faster capital outflows as the dollar surges. The unpredictable nature of Trump’s comments on trade policy only adds to the uncertainty.
The decline in stocks was the “result of amplified impact on market sentiment after the cumulative events of higher government bond yields, a weaker yuan against the dollar and regulatory curbs on insurance funds,” said Chen Li, a strategist at Credit Suisse Group AG in Hong Kong.
After China’s botched introduction of circuit breakers and a series of weaker currency fixings roiled global financial markets in January, the Communist Party took steps to reduce volatility and restore investor faith. While such measures were successful earlier in the year, this month has seen marked deterioration in the stock and bond markets. Citic Securities Co., the nation’s largest brokerage, said last week it was more worried about the money market now than during the 2013 cash crunch, given accelerating fund outflows.
The Shanghai Composite’s decline Monday was the biggest in six months, while the ChiNext gauge of smaller companies traded in Shenzhen sank 5.5 percent. The 10-year sovereign bond yield rose 9 basis points to a one-year high of 3.19 percent, and the yuan fell 0.1 percent to 6.91 per dollar.
One China
Trump’s stance toward China is pressuring the currency and prompting policy makers to keep borrowing costs elevated, according to Ken Peng, Asia investment strategist at Citigroup Global Markets Asia Ltd. in Hong Kong.
Trump said his support for the decades-old One-China policy will hinge on cutting a better deal on trade and that other nations, especially China, shouldn’t be deciding whom he talks to. “I don’t want China dictating to me,” he said in an interview with “Fox News Sunday,” echoing his comment a week ago on Twitter, days after he broke with decades of protocol and spoke by phone with Taiwan’s president.
“As Trump’s comments raise the risk of a trade conflict between the U.S. and China, the yuan probably will continue to face pressure,” Peng said. “Thus domestic liquidity may stay tight, which is negative for stocks.”
Credit Suisse’s Chen also noted the liquidity concern, saying he’s not sure if the strain is due to seasonal factors or government policy. He said he expects the stock decline to continue for about a week.
Equities also slumped as officials move to rein in financial risks associated with a surge in dealmaking by insurers, after the nation’s top securities official likened leveraged stock buyers to “robbers.”
Insurer Buyouts
Gree Electric Appliances Inc. plunged 6.1 percent in Shenzhen after Foresea Life Insurance Co. said it won’t increase its holdings in the company and will gradually sell the shares. China Vanke Co. tumbled 6.3 percent after the insurance regulator suspended Evergrande Life Insurance Co.’s entrusted stock investment. Foresea Life and Evergrande Life have been battling for control at Vanke, the most high-profile target of a buying spree by Chinese insurers since 2014, helping fuel a 45 percent gain in the developer’s shares in August alone.
“The goverment’s move to tighten insurance firms’ leveraged buying is very worrying as that may discourage their future investments and trigger funds to withdraw from the equity market,” said Paul Pong, Hong Kong-based managing director at Pegasus Fund Managers Ltd.
Concern the bubbly housing market is on the brink of a downturn is adding to investor jitters. Construction companies were among the biggest losers on Monday after Vanke’s president predicted home sales will drop “significantly” in the coming year. China City Construction Holding Group, a troubled Beijing-based builder, missed a bond payment due Friday, while there are a record $17.3 billion of developer bonds due next year.
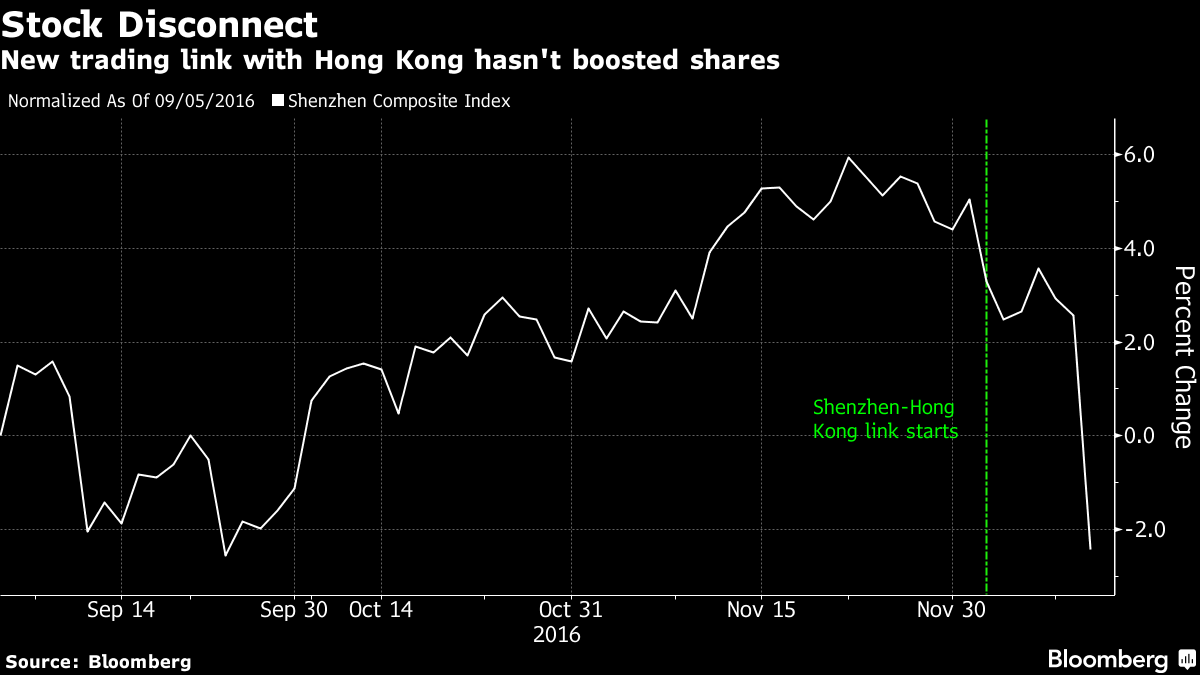
The plunge in Shenzhen-listed stocks comes a week after the city opened its market to the world via an exchange link with Hong Kong. Lackluster demand is removing another key prop for the city’s shares, which rallied in the run up to the start of the link.
“The Shenzhen-Hong Kong connect turnover hasn’t been high,” which may be disappointing the market,” said Sam Chi Yung, senior strategist at South China Financial Holdings Ltd. in Hong Kong. “Liquidity is tighter in China as we’re approaching the year-end, and people may need to sell their investments.”
Posted in Uncategorized | Comments Off on Problems in China