Money Market Pain in China

December 29th, 2016 6:54 am

Via Bloomberg:

China’s Money Market Pain Is About to Get Worse

  • Benchmark repo rate to rise further in first quarter: survey
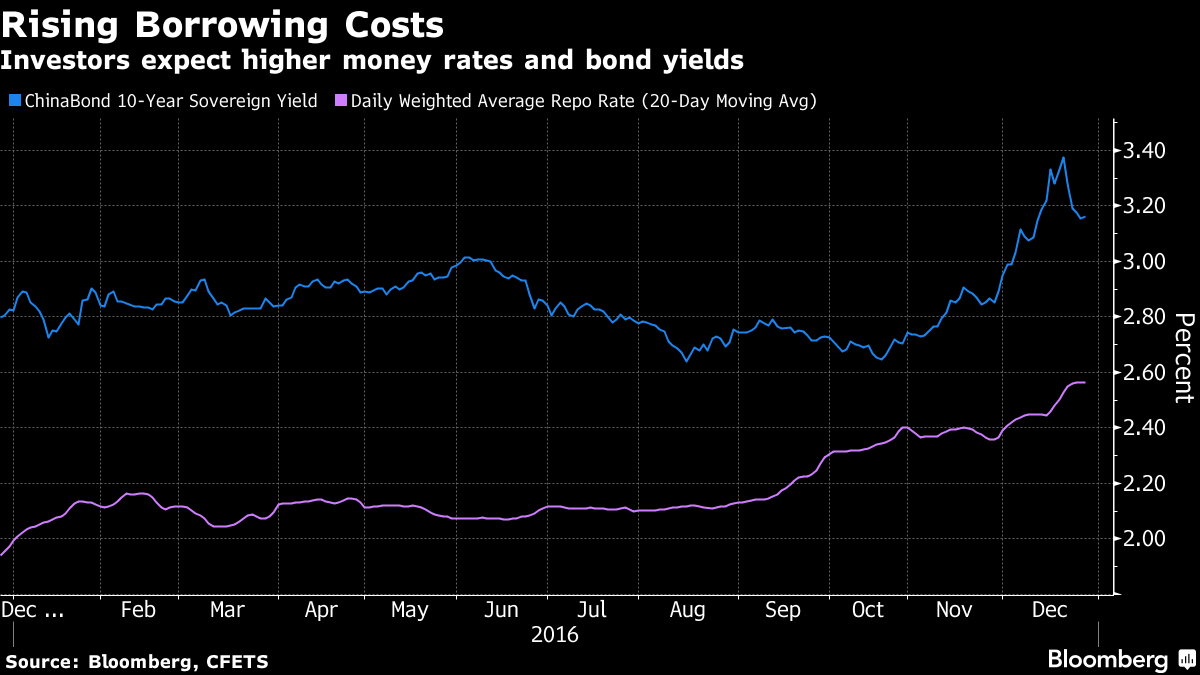
  • Chinese bonds are set for worst month in at least a decade

China’s money-market liquidity squeeze is about to get worse.

The benchmark seven-day repurchase rate will average 2.65 percent in the first quarter, up from 2.47 percent in the current period and the highest since the start of 2015, according to the median estimate in a Bloomberg News survey of 24 bond traders, investors and analysts. More than half the respondents are expecting a record selloff in China’s $7.9 trillion debt market to last until at least the end of March, with the government’s deleveraging push and tighter monetary conditions looming as the biggest risks.

“The central bank’s attitude towards monetary policy has changed fairly significantly in the past six months,” said Liu Dongliang, a senior analyst at China Merchants Bank Co. in Shenzhen. “Market participants are anxious as the tightness at year-end is worse than expected. Tougher monetary conditions and deleveraging are having the same negative impact on domestic liquidity.”

The average interbank repo rate surged to a 20-month high on Dec. 16 on a combination of year-end cash demand and mounting concern over counterparty risks after a brokerage reportedly declined to honor its bond trading agreements. China’s debt market is heading for its biggest monthly decline in at least a decade, ending a record bull run that had been in place since the beginning of 2014 as investors bet the People’s Bank of China would keep financing costs low to bolster the economy.

While the PBOC’s benchmark policy measures don’t signal a change in that stance — interest rates have been on hold for more than a year, and reserve ratio requirements for lenders were last lowered in the first quarter — the central bank has been using other measures to drive up the cost of money in China.

The benchmark seven-day repo rate jumped 15 basis points to 2.72 percent on Thursday, the most in eight months, according to weighted average prices from the National Interbank Funding Center. The cost of borrowing for two weeks surged 86 basis points to 4.46 percent, the most in two years.

Longer-Term Funds

The monetary authority started injecting longer-term funds into the financial system in August, which carry a higher interest rate. The PBOC stopped offering three-month loans through a separate facility the same month and is favoring one-year debt instead, while saying it will “proactively” contain asset bubbles and financial risks.

“Liquidity will be the biggest risk next year,” said Ming Ming, head of fixed-income research at Citic Securities Co. “Smaller financial institutions will face more difficulties in borrowing and the cost will be higher. The big picture in 2017 is de-leverage, so the monetary policy will be neutral to tight — this is negative to the bond market.”

All bar one of the respondents in the Bloomberg survey said liquidity will be “tightly balanced” or “tilt toward tight” next year. One-third of the respondents predicted the central bank will raise the interest rates used in reverse repo operations in the first quarter, according to the survey conducted Dec. 22-26.

The cost of one-year interest-rate swaps, a gauge of market expectations for the benchmark seven-day repurchase rate over a year, is heading for the biggest quarterly advance in three years, jumping 80 basis points since the end of September to 3.35 percent. That’s higher than the 10-year sovereign yield at 3.12 percent on Wednesday, ChinaBond data show.

Below is a summary of other survey findings:

  • Thirteen people expect the current market correction will last till the end of first quarter, seven forecast it to continue till the Chinese New Year holidays at the end of January, while four predict it to end after the first half of next year
  • Average seven-day repo rate will be at 2.6 percent in 2017 versus 2.36 percent this year, median survey response shows
  • Ten-year sovereign bonds will trade at a yield of 3-3.5 percent, and China Development Bank’s similar-maturity debt will yield 3.45-4.05 percent, according to estimates of 2017 yield ranges provided by respondents
  • Two-thirds of those surveyed said the PBOC will continue using its Medium-term Lending Facility, Pledged Supplementary Lending and Standing Lending Facility tools to fill shortfall in base money supply, with only one predicting it will cut reserve requirement ratio this year

The participants in the Bloomberg News survey included China Merchants Bank Co., China Guangfa Bank Co., HFT Investment Management Co., Genial Flow Asset Management Co., Mao Dian Asset Management, and Nanhua Futures Co. Eighteen traders, investors and analysts asked not to be identified as they are not allowed to comment on the matter publicly.

— With assistance by Yuling Yang, Xize Kang, Jing Zhao, and Helen Sun

Relatively Low Hanging Fruit

December 29th, 2016 6:48 am

Via Bloomberg:

Money Market Reform Creates Arbitrage for Short-Term Investors

  • Bond managers can earn extra half percentage point interest
  • Eurodollar futures trim risk in commercial paper trade

Money market reform has a silver lining for some investors.

Bond managers can earn more than half a percentage point of extra interest annualized by buying securities that money market funds are shunning now and by using derivatives to trim the risk, said Dan Dektar, chief investment officer at Amundi Smith Breeden LLC in Durham, North Carolina.

“This is one example of the things you can do in the money markets to improve returns,” Dektar said. The higher returns have “arisen due to safety-minded reform and not due to a deterioration in the soundness of the financial system,” he said. Amundi Smith Breeden manages around $10 billion of assets.

Rules that came into effect in October have dimmed demand for certain kinds of debt — in particular, short-term debt known as commercial paper, a near $1 trillion market of securities issued by companies including banks. The regulations are designed to make the funds safer after a major manager went under during the financial crisis.

Higher Yields

That lack of demand has driven yields higher on commercial paper maturing in six months, Dektar said. In recent weeks Amundi bought commercial paper issued by banks that yielded around 1.32 percent, for example, around the six-month Libor level and a more than seven-year high for the benchmark.

The Federal Reserve is raising rates — it hiked in December for the second time in a year, and the median forecast for voting members implies that the central bank will lift rates three more times next year. That risk can be hedged with Eurodollar futures, Dektar said.

An investor buying three-month commercial paper now earns about 1 percent, based on Libor rates. If the six-month yield is 1.32 percent, that implies that in the second three months of the note’s life, investors will receive an annualized rate of around 1.64 percent. Hedging out the risk of the second three months using Eurodollar futures costs 1.07 percent, meaning an investor can earn an annualized 0.57 percentage point for the second three months while taking relatively little interest-rate risk.

“This is like buying Libor at 57 basis points over Libor,” Dektar said. “It illustrates how disjointed the market has become.” The scenario has occurred in previous years, though is usually associated with stress in the system, according to Dektar.

Credit Risk

There are risks to such a trade, as it means exposure to the underlying credit, according to Wells Fargo Securities LLC strategist Boris Rjavinski.

“You may be able to hedge the Libor component covering the life span of the commercial paper,” he said. “But what may happen is the credit spread of the entity issuing the paper widens, even if Libor doesn’t move. That creates a risk in the trade.”

In October, rules came into effect that require riskier money market funds to pass their paper losses on securities onto investors. Money market funds have historically allowed investors to buy and sell their shares at $1 apiece, which makes the funds seem safe and stable to customers. Under the new rule, if the funds are buying commercial paper and other non-government securities, they must record paper gains and losses daily on the securities they hold, and pass those gains or losses onto investors. That creates an incentive for investors in money market funds to gravitate to funds that buy only government debt.

Some Corporate Bond Stuff

December 29th, 2016 6:45 am

Via Bloomberg:

IG CREDIT: Lowest Volume Wednesday in a Year
2016-12-29 10:53:07.330 GMT

By Robert Elson
(Bloomberg) — Secondary IG trading ended with a Trace
count of $4.8b vs $5.7b Tuesday, $11.5b last Wednesday. It was
the lowest volume Wednesday session since $3.4b 12/30/2015.

* 10-DMA $10.7b vs its recent high of $18.7b as of Nov. 22;
10-Wednesday moving avg fell to $16.4b vs $17.7b
* 144a trading added $350m of IG volume vs $312m Tuesday,
$1.1b last Wednesday

* Trace most active issues:
* Very short 2017 maturities again took the bulk of the
top-10 slots with 8
* In the 4th position was WFC 2.15% 2019 with client flows
accounting for 96% of volume; selling 4.3x buying
* GS 5.75% 2022 was 8th with client and affiliate flows
taking 100% of volume
* BATSLN 1.85% 2018 was the most active 144a issue with client
buying taking 100% of volume

* Bloomberg Barclays US IG Corporate Bond Index OAS unchanged
at +122, a new tight for the year and tying the lowest level
of 2015
* 2016 wide/tight: 215 (a new wide since Jan. 2012)/122
* 2015 wide/tight: 171/122
* 2014 wide/tight: 137/97
* All time wide/tight back to 1989: 555 (Dec. 2008)/54
(March 1997)

* BofAML US Corporate IG Index unchanged at +128, a new tight
for the year and tightest level since Oct. 2014

* Standard & Poor’s Global Fixed Income Research IG Index
unchanged at +168; +167, the tightest spread YTD, was seen
Dec. 23

* Current markets vs early Wednesday, Tuesday levels:
* 2Y 1.242% vs 1.274% vs 1.206%
* 10Y 2.473% vs 2.556% vs 2.554%
* DOW futures -5 vs +34 vs -9
* Oil $53.95 vs $54.23 vs $53.25
* ¥en 116.44 vs 117.68 vs 117.32

* No IG issuance this week
* December totals $45.225b; YTD $1.6T, outpacing 2015 by 7%

* Pipeline – JNJ Added Back to M&A List for 2017

FX

December 29th, 2016 6:42 am

Via Marc Chandler at Brown Brothers Harriman:

Dollar, Equities, and Yields Fall

  • Thin holiday markets see several recent trends reverse
  • News stream is light and moves seem to be more about position adjustments rather than the emergence of new drivers
  • US trade and inventory data will impact Q4 GDP forecasts
  • China announced an increase in currencies that will be included in its basket and the dollar’s weight is shaved

Corrective pressures grip the capital markets today.  Recent trends, like dollar strength, rising yields and rising equities are being reversed today.  US stocks were turned lower yesterday and Japan and European equities are mostly following suit.  Bond yields are softer with UK Gilts leading the way.  The core is outperforming the periphery.  The dollar’s advance, we argued, had been fueled by the rising US yields.  As US yields soften, the dollar is seeing its gains pared.  The dollar-bloc currencies are recovering as well.  Yesterday the US dollar rose to a nine-month high against the Canadian dollar near CAD1.3600, and is nearly a big figure lower now.  Indonesian equities, which had fallen out of favor of offshore investors, are continuing to recover.  Foreign investors are also returning.  Gold is higher and oil is trying to extend winning streak.  

In thin holiday markets, a correction to the trends seen in Q4 has materialized.  The US dollar is heavy.  Japanese and European equities are lower.  Bonds are firmer.  

Some reports try to link the moves to the unexpected weakness in the US pending home sales, but this is a stretch and merely seeks to construction a post hoc explanation for the year-end position adjustments.  Pending home sales is not a report that moves the market.  The 2.5% decline in November is the fourth largest decline of the year, and the other three did not seem to spur a market reaction.  Moreover, the dollar remained firm until after European markets closed yesterday.  In fact, the euro reached its low near $1.0370 several hours after the US report.  

US equities fell yesterday, with the S&P 500 posting its largest decline in a couple of months. The Dow Jones Industrials were turned back again ahead of the psychological 20k level.   Japan, Chinese and Taiwanese equities fell, but most other markets in Asia rose, and this was sufficient to lift the MSCI Asia-Pacific Index by a quarter of a percentage point for the second consecutive session, ending a six-day slide.   Of note, Indonesian equities have continued to recover.  The markets three-day advance has lifted the bourse by 5.2%.  Recall foreigners were consistent sellers of Indonesian equities from early November through the middle of December.   Foreign investors are re-weighting Indonesian exposure and have been net buyers for a sixth session through yesterday, and were seen as buyers today, though the final data has not been reported.   

European equity markets are mixed, but mostly lower, with the Dow Jones Stoxx 600 off about 0.25%.  Financials and materials are the weakest sectors today, while health care, telecoms, and real estate are posting gains.  Yesterday it closed at its highest level of the year.  The Stoxx 600 bank index is off 0.8% today.  Italian bank shares are off around 0.6%, falling for the third session, and likely setting the stage to snap a four-week 25% rally.  

Bonds are rallying.  Core  European bond yields are off 2-3 bp, though the 10-year UK Gilt yield is off six bp.   Yields in the periphery of Europe are only slightly softer.  US 10-year yields continue to fall.  Recall the yield peaked in mid-December near 2.64%.  With today’s four basis point decline, it is at 2.46%, which is below the 20-day moving average for the first time since November 9, the day after the US election.  

The news stream is light.  There have been two economic reports from Europe.  First, EMU money supply increased to a 4.8% pace in November from 4.4%. Recall M3 growth slowed sharply in October from 5.1% in September.  The recovery in November underscores the noisy character of the time series.  Lending ticked up in November.  Credit extended to non-financial firms rose 1.8% from 1.7%, while lending to households increased 2.1%, up from 1.9%.  Second, UK house prices measured by Nationwide, rose 0.8% in December, well above expectations, and sufficient to raise the year-over-year pace to 4.5%, the same as in December 2015.  

The US reports the advanced merchandise trade balance for November.  The deficit is expected to be little changed from just less than $62 bln.  Wholesale and retail inventories will also be reported.  Together, these reports will feed into economists’ forecasts for Q4 GDP.  It does appear that the composition of growth may have shifted, with a little less consumption and a little more investment.   Weekly initial jobless claims are expected to fall but are skewed by the holidays’ and will likely be largely ignored.  

The euro has recovered a cent off yesterday’s lows to test yesterday’s high near $1.0480.   There is near-term potential for additional gains.  The $1.0510 area corresponds to a 38.2% retracement of the euro’s losses since the Fed’s hike.  Above there, we see potential toward $1.0550-$1.0570.  Initial support is now pegged near $1.0460.  

The dollar is threatening to fall below its 20-day moving average against the yen for the first time since the US election.  It is found a little below JPY116.20 today, which also roughly corresponds to the 61.8% retracement of the gains since the Fed hike.  The yen appears sensitive to the falling equities and Treasury yields.  It is also a question of positioning.  In the futures market, speculators have aggressively amassed a large gross short position over the last few weeks, suggestive of other trend followers and momentum players.    A break of JPY116.00 could force other late-dollar longs out and spur a move toward JPY115.25-JPY115.50.  

Sterling is benefiting from the soft US dollar tone.  It had fallen to $1.22 yesterday and recovered to $1.2270 today.  Coming into today’s session, sterling has advanced in only two sessions since December 6.  Today could be the third, but it needs to close above $1.2225.   This week’s high was set a little above $1.23.  Last week’s high was a little above $1.25.  

The dollar-bloc currencies are attracting funds, perhaps as a place to park until liquidity returns.  The Australian dollar has carved out a base near $0.7160.  Initial resistance is seen near $0.7230, and a move above there could spur a recovery toward $0.7300.  The US dollar reached a nine-month high against the Canadian dollar yesterday just shy of CAD1.3600.  It has approached CAD1.35 in the European morning.  Support is seen near CAD1.3475, and a break could see a move toward CAD1.3360.  

Brent is extending its advance for a fifth consecutive session, while WTI is lower and is threatening to end its eight-session march higher.   Gold is higher for the fifth session.  It has not managed to close above its 20-day average since right after the US election.  That average is a little below $1149 today.  

Lastly, we note that China has moved to reduce the role of the dollar in its trade-weighted basket by adding another 11 currencies.  The dollar’s weighting will fall to 22.4% from 26.4%  at the start of 2017.   Several new emerging market currencies will be included such as the South Korean won, the South African rand, the United Arab Emirates’ dirham, Saudi Arabia’s riyal, Hungary’s forint, Poland’s zloty and Turkey’s lira. Although the yuan is at an eight-year low against the dollar,  it is near a four-month high against the current CFETS basket.

Ultra Long Bonds and Treasury Curve

December 28th, 2016 9:44 am

Great article via Bloomberg:

Yield Curve Suggests Sales of Ultra-Long U.S. Bonds Are Unlikely

  • Positive convexity enticement not seen as enough for investors
  • Each basis point increase costs more than for 30-year debt
 

The likely absence of a dip in the tail-end of the yield curve helps tell you why the U.S. Treasury probably won’t be selling ultra-long bonds.

While Steven Mnuchin, President-elect Donald Trump’s pick for Treasury Secretary, said he’d “take a look at everything” in response to a question about 50- and 100-year bonds, an analysis of the projected gap between yields on 30-year bonds and the longer securities signals investors won’t pay enough for the debt for it to make sense for the government.

An upward sloping, or even flat, yield curve between the 30- and 50-year maturities means investors aren’t willing to reward the Treasury a price premium for the debt even though many desire the benefits of positive convexity, which helps enhance returns when yields fall. In the U.K., that’s an enticement that has helped 50-year gilts yield less that sovereign securities maturing two decades sooner.

The Bloomberg’s Treasury spline model — which assumes constant forward rates into the future — implies a U.S. 50-year U.S. bond would yield 3.13 percent, almost matching that of the 30-year. While that’s a theoretical baseline, the Treasury doesn’t seem to expect the curve to kink downward due to positive-convexity demand, such as in the U.K. with its 50-year securities.

“The Treasury has to analyze if the issuance would save taxpayers money on a risk-adjusted basis,” said Amar Reganti, a fixed-income strategist in the asset-allocation group at GMO LLC in Boston and a former deputy director of the Treasury’s Office of Debt Management. “There’s no clear indication a 50-year bond would do that as Treasury isn’t likely to be paid for the extra convexity, which would be reflected in a yield curve being upward sloping between 30- and 50-year bonds.”

The price-to-yield relationship for different maturities, as illustrated below, shows longer-term Treasuries posses more positive convexity, which enhances price gains when yields fall and curtails declines when yields rise.

Treasury officials also doubt that demand for super long-term debt would be consistent beyond initial sales to enable them to continue their goal of regular and predictable issuance.

“How well would a 50-year be priced, distributed, and traded by comparison to existing long-end issuance, and in what size?” Daleep Singh, Treasury acting assistant secretary for financial markets, said at a conference in New York at Columbia University this month. And “to what extent would a 50-year bond reduce the demand for the 30-year bond or its liquidity.”

Since the financial crisis, Treasury officials have focused on locking in low borrowing costs to counter the effect when interest rates normalize. During that time, they have engineered the fastest extension of the average maturity of U.S. debt in history.

In the U.S., ultra-long bonds would more likely mirror France’s schema, with a 50-year yielding about 0.20 percentage point higher than the 30-year, according to strategists at Deutsche Bank AG. This is in part because demand in the U.S. from pension funds — among the biggest buyers of long-term securities — isn’t likely to be a strong as the U.K. Adding to that is the reduced liquidity in the U.S. swap market beyond the 30-year maturity.

For each one-basis point increase in yield, the price value of $1 billion worth of 50-year bonds would fall by $2.96 million, according to Bloomberg calculations using the interest-rate swaps market as a proxy. That prices adjustment figure falls to $2.17 million for the same move on an equal amount of 30-year debt.

Dan Fuss, the 83-year-old vice chairman of Loomis Sayles & Co., said he recalls when a sharply rising yield environment in 1981 made it tough for Treasury to even sell 20-year bonds. That’s one of the reasons he doesn’t think the Treasury will introduce ultra-long bonds. Fuss said he wouldn’t be a buyer.

“If I were the Treasury now, would I do it, sell 50-year bonds?,” Fuss said. “I probably would not. I wouldn’t mess with our market structure.”

Corporate Pipeline

December 28th, 2016 6:42 am

Via Bloomberg:

IG CREDIT PIPELINE: ACAFP Deal Among Those Expected Next Week
2016-12-28 10:11:37.628 GMT

By Robert Elson
(Bloomberg) — Credit Agricole S.A. (ACAFP) Baa2/BBB+, in
mandate, said it would launch in the near future a 5Y and/or 10Y
senior non-Pfd self-led transaction.

* Names That Historically Issue in First Days of January

* January Issuance Again Expected to Be Sizeable

* M&A deals expected in 2017

* Recent updates:
* Apple (AAPL) Aa1/AA+, added as possible early 2017
issuers based on history
* United Technologies (UTX) A3/A-, said in Dec. 14
guidance call it will tap the debt markets in early 2017
to complete its share buyback program
* Mosaic (MOS) Baa2/BBB; $2.5b purchase of Vale fertilizer
ops
* To fund purchase via $1.25b cash, plans debt
issuance
* Fairfax Financial (FFHCN) Baa3/BBB-; $4.9b Allied World
Assurance acq
* May fund $30/shr price via debt issuance, equity,
third party
* 3M (MMM) A1/AA-, plans to add up to $2.8b of debt in
2017, suggesting another yr of incrementally higher
leverage: BI

MANDATES/MEETINGS

* Scentre Group (SCGAU) A1/A; mtgs Dec. 5-8
* ACWA Power; mtgs from Nov. 23
* Adani Ports (ADSEZ) Baa3/BBB-; mtgs from Nov. 13
* Korea Hydro & Nuclear Power (KOHNPW) Aa2/AA; mtgs Oct. 18-20

SHELF FILINGS

* Puget Sound Energy (PSD) A2/A-; $800m debt shelf (Nov. 8)
* Dow Chemical (DOW) Baa2/BBB; debt shelf; last issued in
Sept. 2014 (Oct. 28)
* Darden Restaurants (DRI) Baa3/BBB; debt shelf, last seen in
2012 (Oct. 6)
* Western Union (WU) Baa2/BBB; debt shelf; last issued Nov.
2013 following Oct. 2013 filing (Oct. 3)

OTHER

* European Stability Mechanism (ESM) Aa1/–; mandates for
advisement on inaugural USD issuance (Oct. 21)
* ConAgra (CAG) Baa2/BBB-; could borrow up to $2.5b for
acquisitions, BI says (Oct. 19)

Deja Vu All Over Again

December 28th, 2016 6:39 am

House flipping has made a comeback.


Via the WSJ:

This is a great time to be in the house-flipping business.

The number of investors who flipped a house in the first nine months of 2016 reached the highest level since 2007. About one-third of the deals were financed with debt, a percentage not seen in eight years.

Now Wall Street, which was nearly felled by real-estate forays almost a decade ago, is getting back into the action. A number of banks are arranging financing vehicles for house-flippers, who buy and sell homes in a matter of months. The sector is small—participants say roughly several hundred million dollars in deals have been made in recent months—but it is expected to keep growing.

“The floodgates have opened,” says Eduardo Axtle, a 35-year-old former telecom entrepreneur in Oakland, Calif., who has taken out about 50 home loans over the past five years. These days, he is bombarded with unsolicited emails from brokers offering him access to financing, and fellow flippers invite him to get-togethers that are advertised with YouTube videos showing off recent projects.

Investors are making an average profit of about $61,000 on each flip, up from about $19,000 at the bottom of the market in 2009. The calculation measures the difference between the housing value when an investor purchases the home and when it is sold, according to housing-research firm ATTOM Data Solutions, which is also the parent company of real-estate website RealtyTrac.


In recent months, big banks, including Wells Fargo & Co., Goldman Sachs Group Inc. and J.P. Morgan Chase & Co. have started extending credit lines to companies that specialize in lending to home-flippers. Earlier this month, J.P. Morgan agreed to lend $60 million to 5Arch Funding, an Irvine, Calif., company that caters to flippers, according to people familiar with the deal.

Trying to win business, big banks in the past few weeks have flown executives to Southern California—where much of the house-flipping activity is occurring—to organize funding deals, people familiar with the meetings say.

Home prices across the country are rising, reaching records not seen since before the 2008 financial crisis.

Housing is in relatively short supply. Meanwhile, low interest rates and a surge in demand from institutional buyers have also benefited house-flippers.

The market for house-flipping loans is expected to reach about $48 billion in total sales volume this year, the highest since 2006, according to ATTOM.

Some borrowers say they have been offered debt in excess of the value of the home, also known as the loan-to-value ratio. Others say some lenders are requiring bank statements to get a loan, but not standard documentation such as a W-2 tax earnings statement.

As these loans are made by relatively small finance companies and aren’t classified as owner-occupied loans, they don’t fall under many of the postcrisis rules written for banks and home mortgages. Some banks used to make these loans directly but now fund finance companies instead.

The boom is being accelerated by online lenders such as San Francisco-based LendingHome Corp. and Asset Avenue Inc. in Los Angeles, as well as crowdfunding websites such as Groundfloor Finance Inc., that allow individual investors to fund fix-and-flip loans. LendingHome, backed by venture capital investors, says it has extended more than $1 billion in loans in the 2 ½ years since its launch.

Loans to house-flippers are short term—usually around seven months—and come with interest rates ranging between 7% and 12%. Because real-estate investors are typically higher risk, they put more cash down—sometimes as much as 65%. By comparison, a 30-year home mortgage has an interest rate around 4%, and borrowers typically don’t put more than 25% down.

Over the last year, 37-year-old David Franco has collected profits of more than $200,000 on houses that he has quickly refurbished and resold, turning a hobby into an unexpectedly lucrative business.

“There’s plenty of money to be made,” says Mr. Franco, who lives just outside of Los Angeles.

House-flipping television shows and training “schools” for new investors are proliferating. One “super-intense, hardcore” house-flipping boot camp in Bourne, Mass., promised to teach students about real-estate investing in three days to make “REALLY MASSIVE PROFITS,” according to marketing literature.

The increasing amount of speculative housing in recent months is “concerning,” ATTOM noted in a recent report. “We’re starting to see home-flipping hit some milestones not seen since prior to the financial crisis.”

ATTOM said profit margins are getting squeezed in some markets. While house-flippers typically aim to purchase a house at a 30% discount to the market, in some areas they’re buying homes at a 15% or 10% discount, said Senior Vice President Daren Blomquist. The research firm noted that the number of smaller, inexperienced house-flippers entering the market is a sign of rising speculation.

George Geronsin, 36, a Southern California real-estate agent and house-flipper who has been in the business since 2008, said he recently sold the majority of the homes he was working on and is sitting on cash “until the next big correction” in the housing market.

“Anybody and everybody is getting into the business of house-flipping—that’s when you know it’s the end of the rope,” said Mr. Geronsin.

Investors in one large crowdfunding site, Realty Mogul Co., were interested in funding $1 billion in fix-and-flip loans through its marketplace, said Chief Executive Jilliene Helman. But the company decided to stop making such loans this summer because competition among lenders meant it couldn’t charge a high enough interest rate to make up for the risk.

Another question mark is the future of long-term interest rates. Since Donald Trump’s surprise election victory, mortgage rates have been surging. If the trend continues, it is likely to chill housing markets, making it harder for investors to quickly flip homes for a profit.

There are only imprecise ways to measure home-flip default risks. The foreclosure rate for loans secured by investment properties is 0.43% compared with 0.6% for loans on owner-occupied homes, but the foreclosure rate for investment property loans originated in 2016 is more than double owner-occupied homes, according to ATTOM.

Finance companies say their loans to home-flippers are prudent. LendingHome, for example, says it limits its average loan size to reduce risk.

Big banks are offering lenders credit lines ranging from $5 million to $150 million, with interest rates between 3.5% and 6%, say the people familiar with the deals.

The banks say they are shielded from major losses because their loan deals are backed by pools of securitized loans, sheltering them from a potential bankruptcy of the lender. In the 5Arch deal with J.P. Morgan, for example, the bank securitized 150 5Arch loans in the $60 million bond, and then lent out a portion of that amount back to 5Arch in what operates like a credit line. The bank can also sell pieces of the resulting bond to other investors if it chooses.

Ahead of any funding deal, bankers say they are spending weeks reviewing the underwriting process that lenders use, making sure that borrowers will be able to repay their loans.

Anchor Loans, one of the largest private lenders to house-flippers, is among the beneficiaries. The Calabasas, Calif. company has received more than $220 million in new credit facilities, mostly from major banks, in 2016 alone, said Chief Executive Stephen Pollack, who declined to identify the banks.

After the financial crisis, a shortage of funding from large banks meant that Anchor had to turn away fix-and-flip business.

This year, the company is on track to originate $1.1 billion in loans to real-estate investors, up from $713 million in 2015, Mr. Pollack says. “For the first time in our history, we actually have enough money to lend.”

Write to Kirsten Grind at [email protected] and Peter Rudegeair at [email protected]

Early Corporate Bond Stuff

December 28th, 2016 6:35 am

Via Bloomberg:

IG CREDIT: Very Short Issues Led Low Volume Trading Session
2016-12-28 10:36:40.869 GMT

By Robert Elson
(Bloomberg) — Secondary IG trading ended with a Trace
count of $5.7b vs $2.2b Friday, $13.4b the previous Tuesday. 10-
DMA $12.1b; 10-Tuesday moving avg $17b.

* 144a trading added $312m of IG volume vs $229m Friday, $1.6b
last Tuesday

* Trace most active issues:
* Very short 2017 maturities took 9 of the top-10 slots
* In the 8th position was PAA 4.65% 2025 with evenly-
weighted 2-way client flows accounting for 100% of
volume
* 2017 maturities aside, PEMEX 6.50% 2027 was the most active
144a issue with client buying taking 93% of volume

* Bloomberg Barclays US IG Corporate Bond Index OAS at +122, a
new tight for the year and tying the lowest level of 2015,
vs +123
* 2016 wide/tight: 215 (a new wide since Jan. 2012)/122
* 2015 wide/tight: 171/122
* 2014 wide/tight: 137/97
* All time wide/tight back to 1989: 555 (Dec. 2008)/54
(March 1997)

* BofAML US Corporate IG Index at +128, a new tight for the
year and tightest level since Oct. 2014, vs +129

* Standard & Poor’s Global Fixed Income Research IG Index at
+168 vs +167, the tightest spread YTD

* Current markets vs early Tuesday levels:
* 2Y 1.274% vs 1.206%
* 10Y 2.556% vs 2.554%
* DOW futures +34 vs -9
* Oil $54.23 vs $53.25
* ¥en 117.68 vs 117.32

* No IG issuance Tuesday
* December totals $45.225b; YTD $1.6T, outpacing 2015 by 7%

Crowded Trades

December 27th, 2016 7:32 pm

Via Bloomberg:

UBS: Here Are the Most Crowded Stocks in the World Right Now

Popularity has its pitfalls.

If you have Amazon.com Inc., Microsoft Corp. or Alphabet Inc. in your portfolio, you’re in good company.

Analysts at UBS Group AG have examined the equity holdings of actively managed funds worldwide to work out, by reference to FactSet institutional-ownership data, which stocks are the most over- and under-owned relative to their benchmark weightings.

UBS is flagging potential bubbles amid the bull market in equities that’s kept pace despite the uncertainty that surrounds the incoming Trump administration, and the elections scheduled next year across Europe. “Once these trades reach their critical value, or an exogenous shock occurs, we expect a sharp price reversal as investors unwind their exposure in tandem,” UBS had said in an earlier report alerting clients to the dangers of over-crowded positions.

The most valuable company in the world turns out to be this year’s laggard: Apple Inc. is the stock that fund managers are now most strongly underweight, according to the calculations of the UBS analysts led by Shanle Wu. That finding is backed up by data from brokerage firm TD Ameritrade, which shows that through Dec. 15, the tech giant was one of 2016’s top five most-sold stocks.

“People are starting to take profits in some companies,” JJ Kinahan, Ameritrade’s chief market strategist said in an interview. “Investors are realizing that not every trade has to or will be a home run.”

Here’s a look at the full list of the 10 most over- and under- owned companies across the globe.

Screen Shot 2016-12-27 at 7.30.52 AM
UBS Group AG

Index Extension at Month End

December 27th, 2016 4:35 pm

Via a fully paid up subscriber:

Bloomberg Barclays Updates Index Duration Changes for Jan. 1 14:55

Bloomberg Barclays estimated the following duration extensions for Jan. 1 as of Dec. 23 (comparisons are to Dec. 16 ests.):
• U.S. Treasury: 0.07yrs vs 0.08yrs
• U.S. Agency: 0.13yrs, unchanged
• U.S. Credit: 0.08yrs vs 0.07yrs
• U.S. Govt/Credit: 0.08yrs vs 0.07yrs
• U.S. MBS: 0.13yrs vs 0.11yrs
• U.S. Aggregate: 0.09yrs vs 0.08yrs
• U.S. High Yield: 0.10yrs vs 0.09yrs